PDF Publication Title:
Text from PDF Page: 008
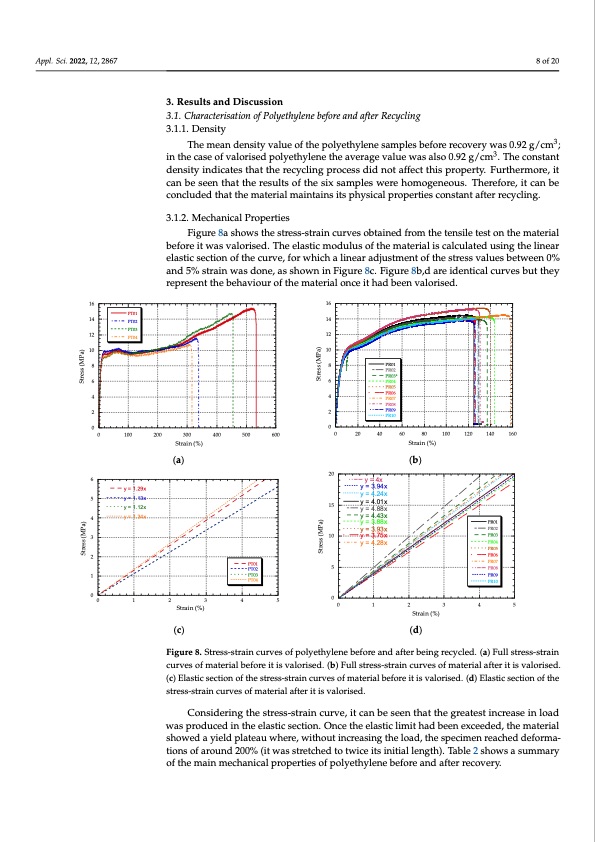
Appl. Sci. 2022, 12, 2867 8 of 20 The mean density value of the polyethylene samples before recovery was 0.92 g/cm3; The mean density value of the polyethylene samples before recovery w3as 0.92 g/cm3; in the case of valorised polyethylene the average value was also 0.92 g/cm . The constant 16 14 12 10 16 14 12 10 (a) (b) Figure 7. (a) Water permeability test layout. (b) Example of the moisture trace after the water per- meability test. 3. Results and Discussion 3.1R. eCshualrtascatenrdisaDtiiosncuofssPiolnyethylene before and after Recycling 3.1. Characterisation of Polyethylene before and after Recycling 3.1.1. Density 3.1.1. Density in the case of valorised polyethylene the average value was also 0.92 g/cm3. The constant density indicates that the recycling process did not affect this property. Furthermore, it density indicates that the recycling process did not affect this property. Furthermore, it can be seen that the results of the six samples were homogeneous. Therefore, it can be can be seen that the results of the six samples were homogeneous. Therefore, it can be concluded that the material maintains its physical properties constant after recycling. concluded that the material maintains its physical properties constant after recycling. 3.1.2. Mechanical Properties 3.1.2. Mechanical Properties Figure 8a shows the stress-strain curves obtained from the tensile test on the material Figure 8a shows the stress-strain curves obtained from the tensile test on the material before it was valorised. The elastic modulus of the material is calculated using the linear before it was valorised. The elastic modulus of the material is calculated using the linear elastic section of the curve, for which a linear adjustment of the stress values between 0% elastic section of the curve, for which a linear adjustment of the stress values between 0% and 5% strain was done, as shown in Figure 8c. Figure 8b,d are identical curves but they and 5% strain was done, as shown in Figure 8c. Figure 8b,d are identical curves but they represent the behaviour of the material once it had been valorised. represent the behaviour of the material once it had been valorised. PR01 PR02 PR03* PR04 PR05 PR06 PR07 PR08 PR09 PR10 PT01 PT02 PT03 PT04 88 66 44 22 00 9 of 21 Appl. Sci. 2022, 12, x FOR PEER REVIEW 0 100 200 300 400 500 600 0 20 40 60 80 100 120 140 160 Strain (%) (b) Strain (%) (a) y = 4x y = 3.94x y = 4.24x y = 4.01x y = 4.88x y = 4.43x y = 3.88x y = 3.93x y = 3.75x y = 4.28x PR01 PR02 PR03 PR04 PR05 PR06 PR07 PR08 PR09 PR10 6 5 4 3 2 1 0 20 15 10 5 y = 1.29x y = 1.13x y = 1.12x y = 1.34x PT01 PT02 PT03 PT04 Material before valorisa- 121.93 9.55 13.16 425.62 012345 Strain (%) 0 012345 Strain (%) (c) Figure 8. Stress-strain curves of polyethylene before and after being recycled. (a) Full stress-strain Figure 8. Stress-strain curves of polyethylene before and after being recycled. (a) Full stress-strain curves of material before it is valorised. (b) Full stress-strain curves of material after it is valorised. curves of material before it is valorised. (b) Full stress-strain curves of material after it is valorised. (c) Elastic section of the stress-strain curves of material before it is valorised. (d) Elastic section of (c) Elastic section of the stress-strain curves of material before it is valorised. (d) Elastic section of the the stress-strain curves of material after it is valorised. stress-strain curves of material after it is valorised. Considering the stress-strain curve, it can be seen that the greatest increase in load Considering the stress-strain curve, it can be seen that the greatest increase in load was produced in the elastic section. Once the elastic limit had been exceeded, the material was produced in the elastic section. Once the elastic limit had been exceeded, the material showed a yield plateau where, without increasing the load, the specimen reached defor- showed a yield plateau where, without increasing the load, the specimen reached deforma- mations of around 200% (it was stretched to twice its initial length). Table 2 shows a sum- tions of around 200% (it was stretched to twice its initial length). Table 2 shows a summary mary of the main mechanical properties of polyethylene before and after recovery. of the main mechanical properties of polyethylene before and after recovery. Table 2. Mechanical properties of polyethylene before and after being recycled. Elasticity Modulus (MPa) Yield Strength (MPa) Breaking Strength (MPa) Strain under Max. Load (%) (d) Stress (MPa) Stress (MPa) Stress (MPa) Stress (MPa) tionPDF Image | Recycled Polyethylene Fibres for Structural Concrete
PDF Search Title:
Recycled Polyethylene Fibres for Structural ConcreteOriginal File Name Searched:
applsci-12-02867.pdfDIY PDF Search: Google It | Yahoo | Bing
Development of a solar powered Electric Ship The Electricship website originally started off as a project to develop a comprehensive renewable, affordable, modular electric ship... More Info
Modular Boat Hull Composite The case for a unsinkable, modular composite hybrid boat hull... More Info
MS Burgenstock Hybrid Electric Catamaran Lake Lucerne Unique shuttle servicing Lucerne to the Burgenstock Resort... More Info
Ground Power Unit GPU Powered by Lithium Ion Batteries The goal of the Ground Power Unit is to provide a readily accessible, modular, ready-to-power solution for remote power... More Info
| CONTACT TEL: 608-238-6001 Email: greg@electricship.com | RSS | AMP |