PDF Publication Title:
Text from PDF Page: 009
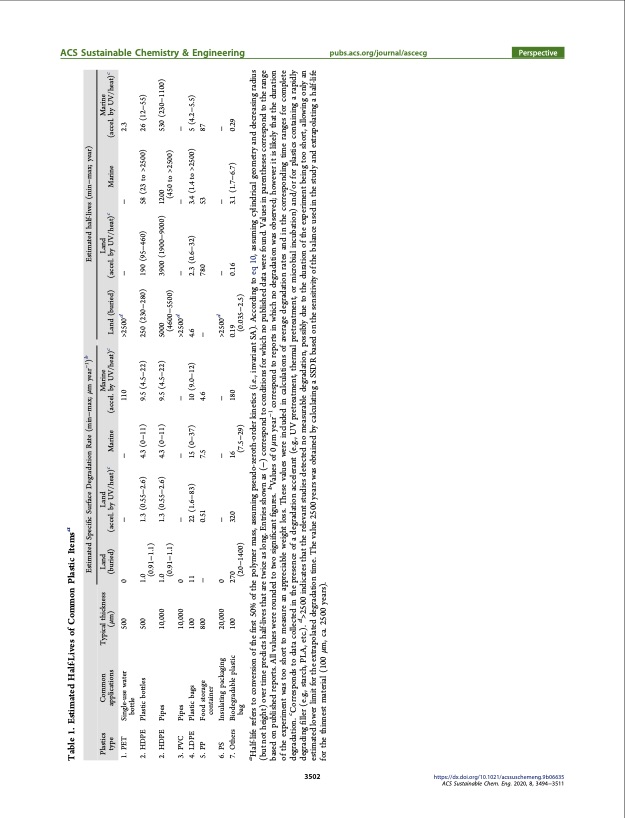
ACS Sustainable Chemistry & Engineering pubs.acs.org/journal/ascecg Perspective 3502 https://dx.doi.org/10.1021/acssuschemeng.9b06635 ACS Sustainable Chem. Eng. 2020, 8, 3494−3511 Table 1. Estimated Half-Lives of Common Plastic Itemsa Estimated Specific Surface Degradation Rate (min−max; μm year−1)b Estimated half-lives (min−max; year) Plastics type Common applications Typical thickness (μm) Land Land c (buried) (accel. by UV/heat) Marine Marine c (accel. by UV/heat) Land (buried) >2500d Land c (accel. by UV/heat) Marine Marine c (accel. by UV/heat) 1. PET Single-use water bottle 500 0 − 1.0 1.3 (0.55−2.6) − 110 − − 2.3 26 (12−55) 530 (230−1100) 2. HDPE Plastic bottles Pipes 500 (0.91−1.1) 1.0 1.3 (0.55−2.6) 4.3 (0−11) 9.5 (4.5−22) 250 (230−280) 5000 190 (95−460) 58 (23 to >2500) 2. HDPE 10,000 (0.91−1.1) 0 − 11 22 (1.6−83) − 0.51 4.3 (0−11) 9.5 (4.5−22) (4600−5500) >2500d 3900 (1900−9000) 1200 (450 to >2500) 3. PVC 4. LDPE 5. PP Pipes 10,000 100 800 − 15 (0−37) 7.5 − 10 (9.0−12) 4.6 − 2.3 (0.6−32) 780 − − 5 (4.2−5.5) 87 6. PS 7. Others Insulating packaging 20,000 100 0 − 270 320 − − >2500d 0.19 − − 3.1 (1.7−6.7) − Plastic bags 4.6 3.4 (1.4 to >2500) 53 Food storage container − Biodegradable plastic bag (20−1400) 16 (7.5−29) 180 (0.035−2.5) 0.16 0.29 aHalf-life refers to conversion of the first 50% of the polymer mass, assuming pseudo-zeroth-order kinetics (i.e., invariant SA). According to eq 10, assuming cylindrical geometry and decreasing radius (but not height) over time predicts half-lives that are twice as long. Entries shown as (−) correspond to conditions for which no published data were found. Values in parentheses correspond to the range based on published reports. All values were rounded to two significant figures. b Values of 0 μm year−1 correspond to reports in which no degradation was observed; however it is likely that the duration of the experiment was too short to measure an appreciable weight loss. These values were included in calculations of average degradation rates and in the corresponding time ranges for complete degradation. cCorresponds to data collected in the presence of a degradation accelerant (e.g., UV pretreatment, thermal pretreatment, or microbial incubation) and/or for plastics containing a rapidly degrading filler (e.g., starch, PLA, etc.). d>2500 indicates that the relevant studies detected no measurable degradation, possibly due to the duration of the experiment being too short, allowing only an estimated lower limit for the extrapolated degradation time. The value 2500 years was obtained by calculating a SSDR based on the sensitivity of the balance used in the study and extrapolating a half-life for the thinnest material (100 μm, ca. 2500 years).PDF Image | Degradation Rates of Plastics in the Environment
PDF Search Title:
Degradation Rates of Plastics in the EnvironmentOriginal File Name Searched:
acssuschemeng-9b06635.pdfDIY PDF Search: Google It | Yahoo | Bing
Development of a solar powered Electric Ship The Electricship website originally started off as a project to develop a comprehensive renewable, affordable, modular electric ship... More Info
Modular Boat Hull Composite The case for a unsinkable, modular composite hybrid boat hull... More Info
MS Burgenstock Hybrid Electric Catamaran Lake Lucerne Unique shuttle servicing Lucerne to the Burgenstock Resort... More Info
Ground Power Unit GPU Powered by Lithium Ion Batteries The goal of the Ground Power Unit is to provide a readily accessible, modular, ready-to-power solution for remote power... More Info
| CONTACT TEL: 608-238-6001 Email: greg@electricship.com | RSS | AMP |